Recently we shared the USDA Cover Crop Chart (v. 3.0) on Twitter and the response to this fabulous resource was impressive. So, we decided this easy-to-use chart needed to make its way to our ILSoyAdvisor blog.
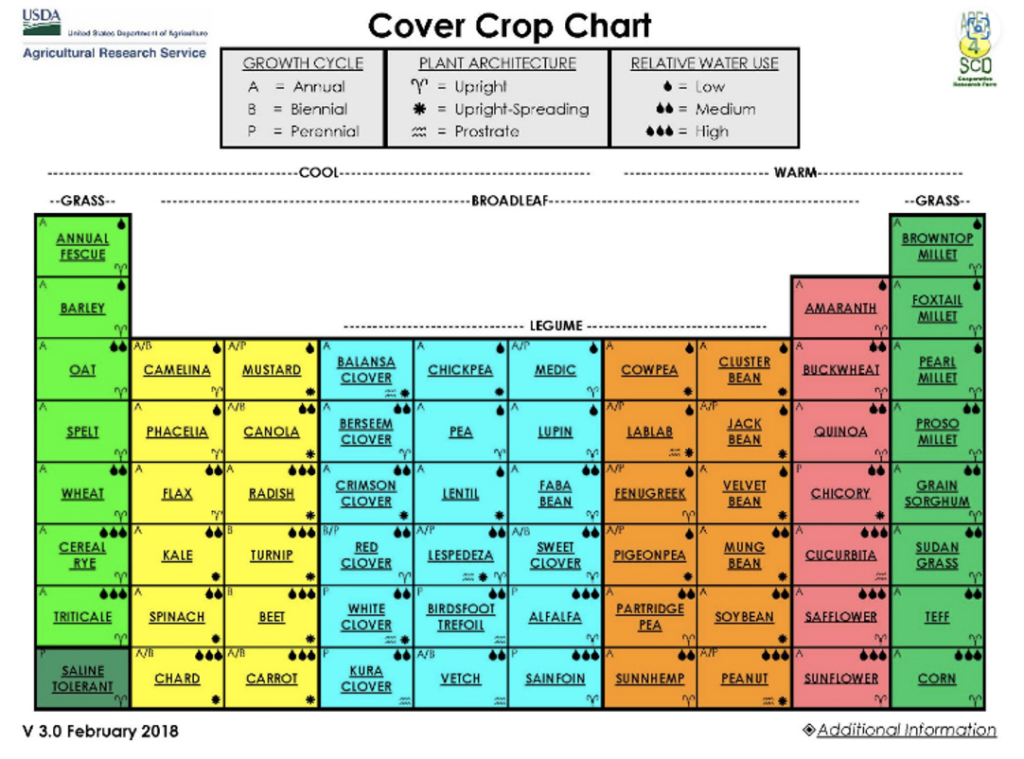
This chart was modeled after the periodic table, and it was designed to help producers make cover crop use decisions on their farm or forage production system. It can be downloaded to a computer near you and requires Adobe Acrobat software.
Once this chart is downloaded, users can easily click on the name of one of the 66 cover crop species on the chart and this will direct them to more information such as growth cycle, relative water use, plant architecture, seeding depth, forage quality, pollination characteristics, and nutrient cycling. In addition, each cover crop species has “Back to Cover Crop Chart” icons that do exactly what they say; they will take users back to the chart for easy comparisons of different cover crops species. Remember, any of these species on this Cover Crop Chart can be planted alone or in cocktail mixtures.
Remember to check back to the USDA website for future updated versions of this Cover Crop Chart.
Check out the USDA website for more information regarding the Cover Crop Chart:
“The Cover Crop Chart represents a compendium of information from multiple sources, and is not based on research conducted at the USDA-ARS Northern Great Plains Research Laboratory (NGPRL). Primary sources of information included the Midwest Cover Crops Council, USDA-SARE, USDA-NRCS PLANTS Database, relevant peer-reviewed journal articles, and the 3rd edition of Managing Cover Crops Profitably (Andy Clark, Ed.).”
“Information on specific crops is occasionally generalized and/or approximate, and may not reflect performance in on-farm conditions. Accordingly, USDA-ARS makes no guarantee to the performance of specific crops based on information provided within the Cover Crop Chart.”
“The Cover Crop Chart is produced and distributed by staff of the USDA-ARS NGPRL, Mandan, ND. Mark Liebig and Holly Johnson contributed to the design and content of the chart with input from NGPRL staff, producers and technicians from the Area IV Soil Conservation Districts of North Dakota, NRCS staff at the Bismarck and Dickinson field/area offices, ARS staff conducting cover crop research, and personnel at the Bismarck Plant Materials Center.”
For further information please contact:
Cover Crop Chart
USDA-ARS NGPRL
P.O.Box 459
Mandan, ND 58554-0459
O: 701 667-3079
F: 701 667-3054
E: mark.liebig@usda.gov
About the Author: Stephanie Porter
One Comment
Leave A Comment


 and then
Please add Annual rye grass to the chart