Most farmers and agronomists would agree that seed selection is one of the single most important decisions that can be made for an upcoming crop. From this single decision, one will determine field selection, row width, seeding depth, seed treatments, herbicides, nutrients, etc. Therefore, selection is a significant factor for a successful and profitable growing season. I have always recommended to my customers the importance to “control the controllable.” Since there are so many factors that play into yield, profitability and sustainability that one cannot control, it’s important to redirect this energy to items that one can.
1. We can’t control the market price, but:
- We can use seed treatments to maximize a quality stand.
- We can select varieties that have multiyear performance results to boost yield potential.
2. We can’t control the weather, but:
- We can plant a variety of soybean genetics to offset seasonal risk.
- We can use seed treatments to ensure full stand establishment.
- We can proactively treat a field with a fungicide and an insecticide to enhance grain fill.
3. We can’t control fertilizer prices, but:
- We can proactively soil-sample fields to be more efficient with limited resources.
- We can balance the soil pH to improve nutrient availability.
The below data chart is from actual yield data from Illinois farmer plots from 2017, 2018 and 2019. This data set indicates how many comps per year, the percentage of wins (A vs. B), moisture and ultimately yield. When selecting seed, it’s important to select a soybean variety that has great top-end potential with a high WIN ratio. This information can provide a level of assurance that the selected bean will perform with a high level of confidence (again we can control which variety is selected).
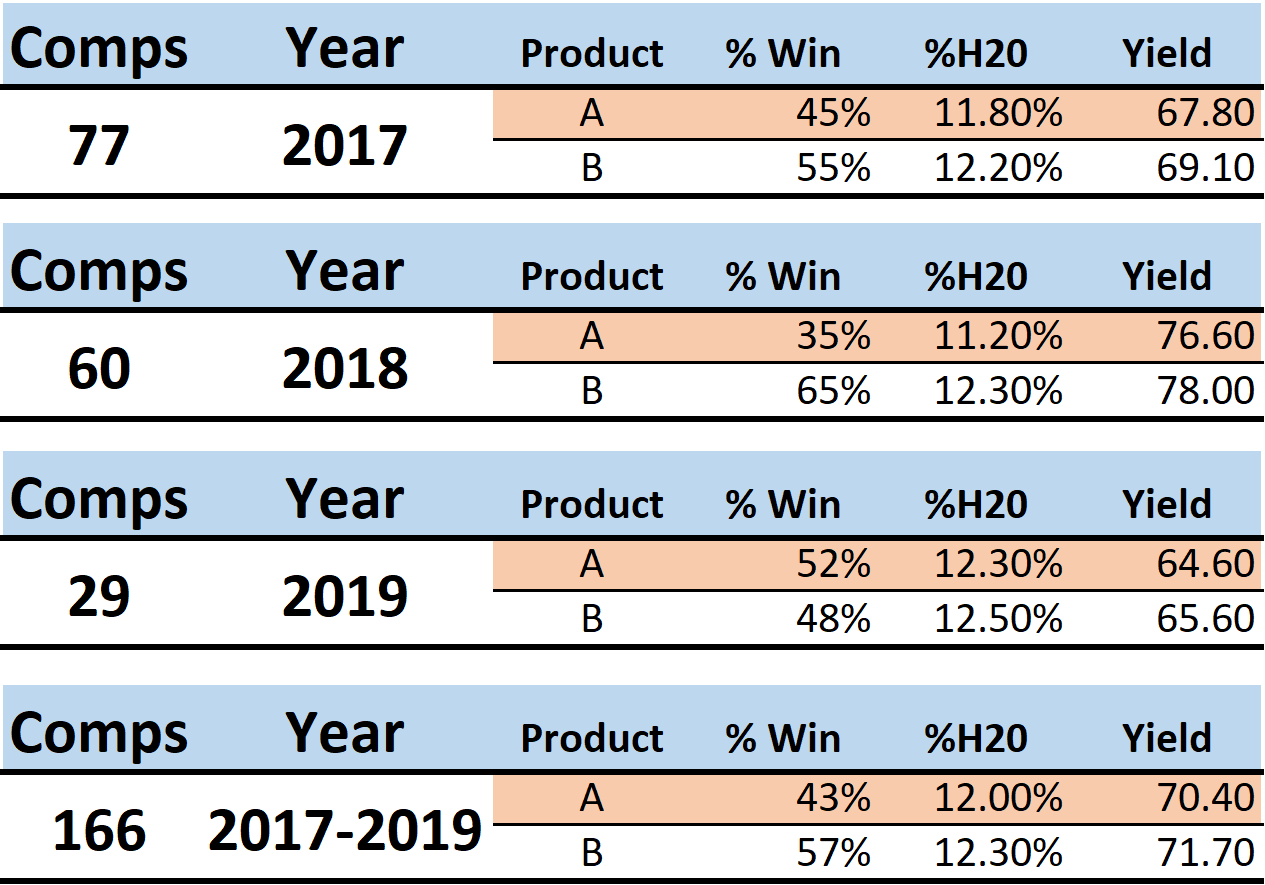
Across 3 environmental years + 166 comps, product B has a 57% win over product A. In most situations, 57% may not seem that great, but in the seed world a 57-70% win is very good.
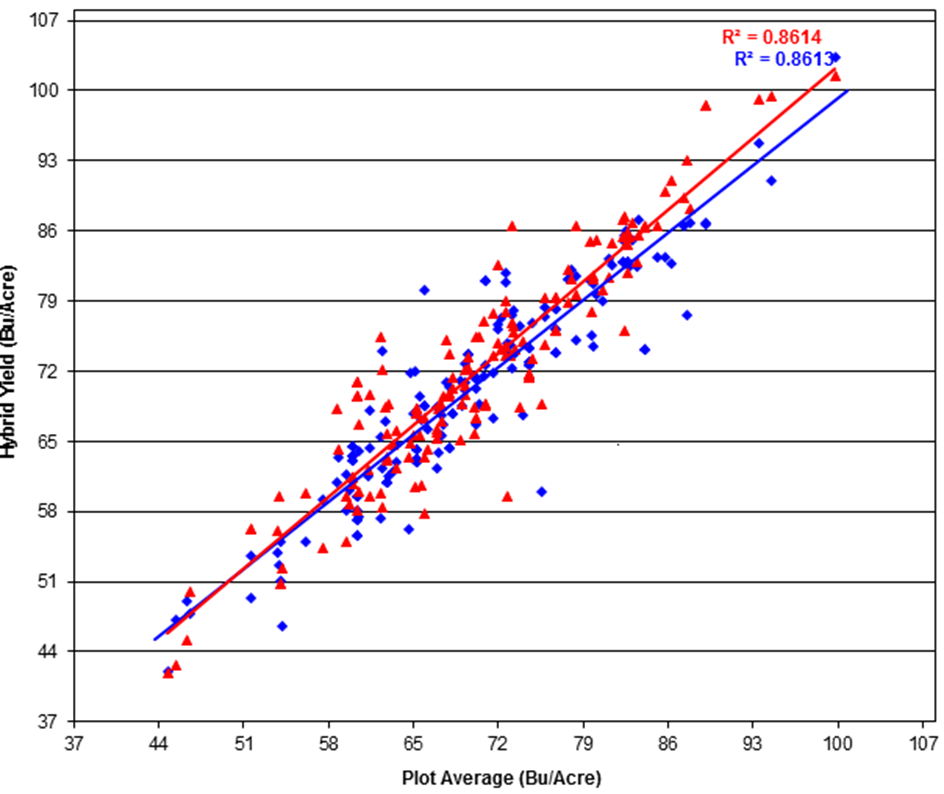
The below chart is a summary of all 166 data points across 2017, 2018 and 2019. The red dots and lines represent Bean Variety B and the blue dots and lines represent Bean Variety A. Each dot represents yield at a given plot (left) versus the plot average (bottom). This information gives statistical analysis of how these two varieties will perform against each other when placed in different yield environments. For example, in the upper right Variety B (red) is surpassing Variety A (blue), this would suggest that Variety B would most likely outperform Variety A in a high yield environment.
Plot Summary: IL 2017, 2018, 2019 (Variety A vs. Variety B)
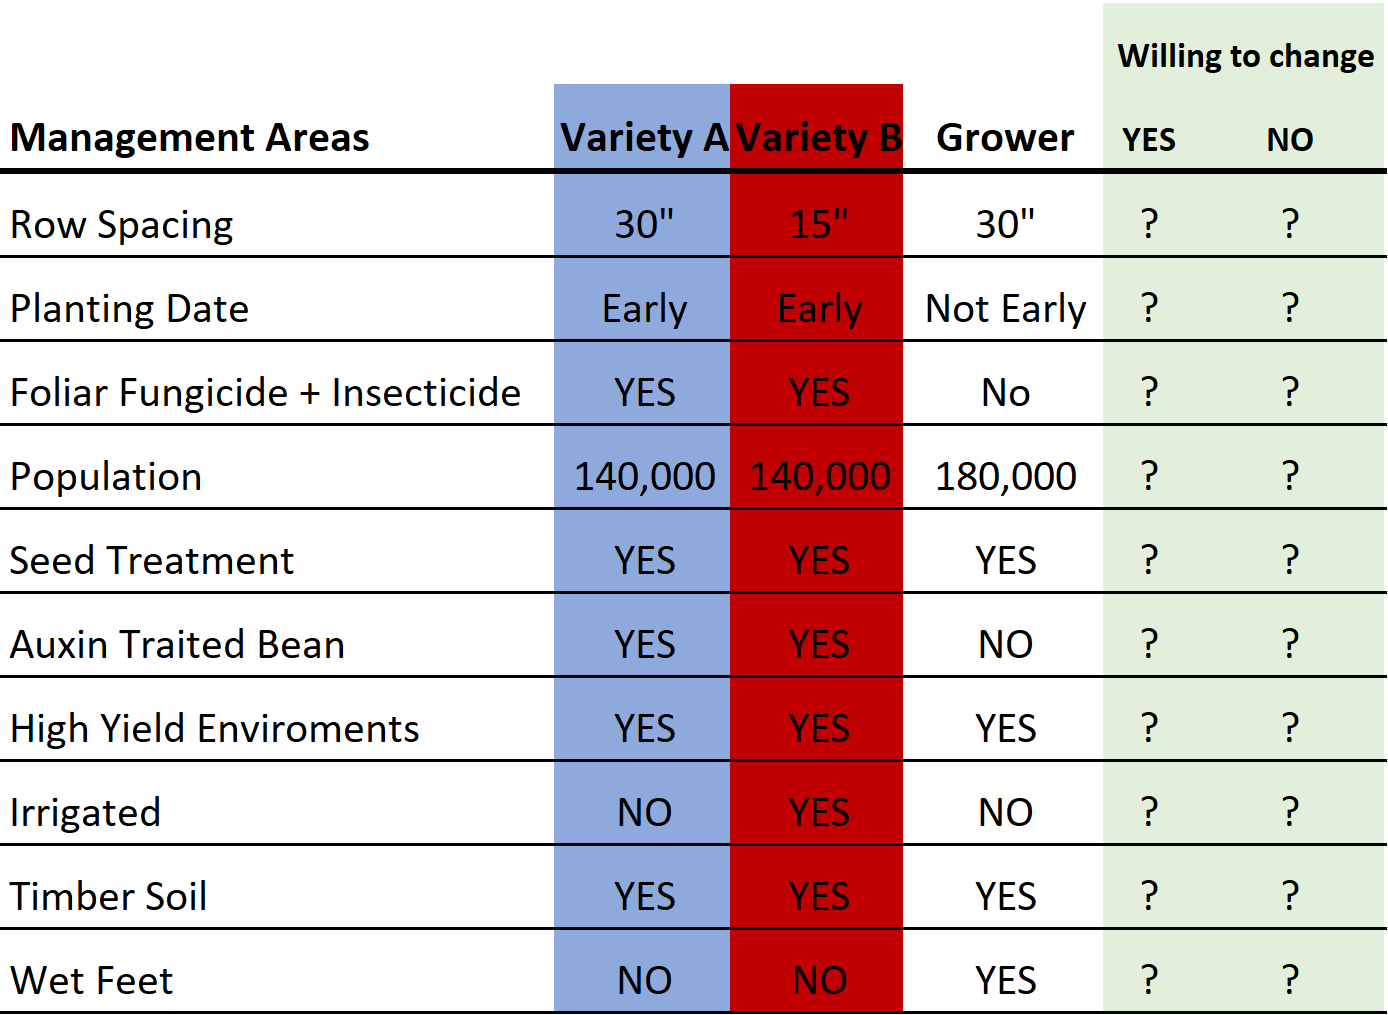
After deciding which elite soybean varieties perform the best in one’s regional areas, determine if the selected bean is a good partner for the farmer since not all soybean varieties are created equal nor are individual farmers’ production styles. Will you manage the variety how it wants to live and grow, or will you require it to live and grow based off your management style? Below is just an example and everyone should create their own for their selected varieties, fields, management styles and the willingness to change to meet the needs of the selected varieties.
About the Author: Todd Steinacher
Steinacher is an ISA CCA Soy Envoy alum and currently supports ISA on agronomic content as well as serving as an Illinois CCA board member. He was recently awarded the 2020 IL CCA of the Year & the 2021 International CCA of the Year. He has over 15 years agronomic experience, currently working with AgriGold and GROWMARK previously. Steinacher has an associate degree from Lincoln Land Community College, a B.S. in agronomy and business from Western Illinois University and a master’s degree in crop science from the University of Illinois at Urbana-Champaign.


 and then