Using Cation Exchange Capacity (CEC) to make fertility management decisions is a philosophy. There are many different philosophies that incorporate CEC into their recommendations. Many of these philosophies have some good science in them, some just enough to make them seem legit and some could be dangerous.
CEC Definition
Cation Exchange Capacity (CEC), or sometimes called total exchange capacity (TEC) by some soil test labs, is a measure of the total negative charges within the soil that adsorb plant nutrient cations such as, but not limited to, calcium (Ca2+), magnesium (Mg2+) and potassium (K+). In simple terms, CEC is the magnetic attraction between the soil (negatively charged) and the cation (positively charged) nutrient ions.
Remember, not all nutrient ions are cations. Some nutrients are anions or negatively charged. Phosphorus (P) is an example of an anion, and they are NOT held on the CEC site. The soil and phosphorus ions are both negative and they repel each other.
CEC of different soil types, textures, and soil organic matter
Actual or true CEC of a soil is based on the percent of sand, silt, and clay that make up the soil as well as the type of clay and percent of organic matter in the soil. Below is a table from University of Georgia showing the different exchange capacities of various soil materials.
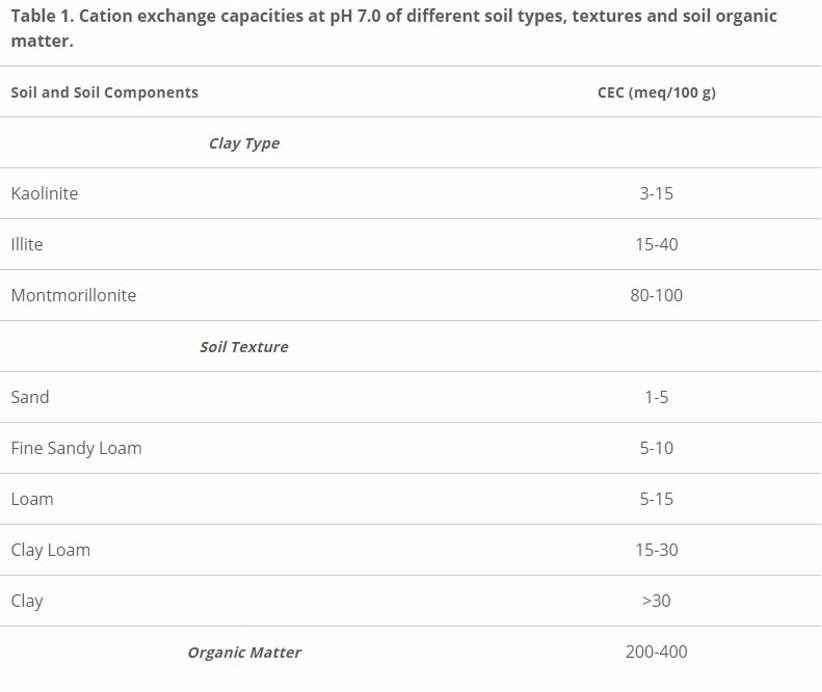
As a rule of thumb, I was taught that organic matter (OM) contributes about 2.5 times more to CEC capacity than clay. Therefore, dark organic soils have CEC values 3 to 4 times those of timber soils. For example, in southern Illinois, clay knobs will have higher CEC values than the post oak flats strictly because of their clay content. So, the CEC value by itself isn’t necessarily a good indication of a soil value or productivity. The organic soil with a 20 CEC would be much more productive than a clay knob with the same CEC. Therefore, CEC is not an indication of yield potential, but just the ability to hold cations.
How is CEC measured?
The CEC is a property of a soil that describes its capacity to supply nutrient cations to the soil solution for plant uptake. Nutrient cations that we focus on are calcium (Ca2+), magnesium (Mg2+), potassium (K+), sodium (Na+), Ammonia (NH3+) and hydrogen (H+).
CEC is measured in milliequivalents per 100g of soil. You may see it expressed as cmolc/kg, me/100g or mel/100g. All are expressing the same measurement.
1 milliequivalent of CEC can hold:
440 lbs of Calcium,
240 Lbs of Magnesium,
720 lbs of Potash,
480 lbs of Na or sodium
AND 360 lbs of Ammonia.
Micronutrient cations such as zinc, copper, iron and manganese are typically present at very low concentrations in soils.
Soil testing laboratories do not usually provide a direct measure of CEC. Instead, the CEC is estimated (calculated) based on the quantities of Ca2+, Mg2+, and K+ extracted during the testing procedure and there are several different formulas to do this. Most labs use the soil test pH for estimating hydrogen. Some labs use a formula based on buffer pH in calculations. Other labs include exchangeable Na (sodium) and estimate the “other bases” (micronutrients) when making their CEC calculation.
Examples of why there are differences or swings when calculating or estimating CEC
Another reason for differences in CEC or swings in CEC is using the soil pH in the calculation. Below is a chart where I used the same soil test values for Ca, Mg, K and Na and the only difference is the soil pH.
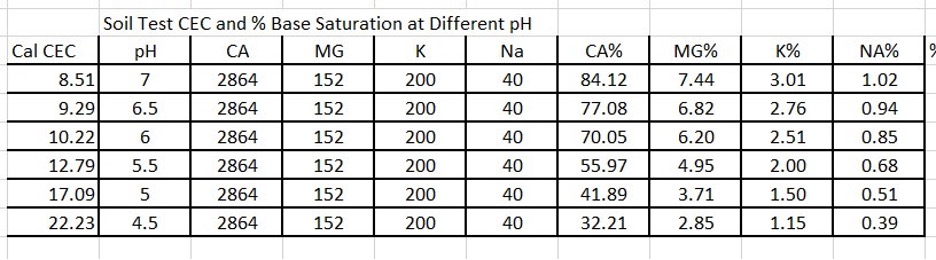
Notice as the soil pH goes down, the CEC of the soil goes up. This is because the formula is estimating higher free Hydrogen (H) in the soil at lower pH. These different formulas can be one reason why there are wide variations in soil test CEC from one soil test lab to another with the same soil sample. This example shows that CEC is a constant moving target. And thus, using a calculated CEC to do any fertility management is useless as the CEC can change based on the formula that the lab uses, and the amount of ESTIMATED hydrogen (H) ions based on the soil pH.
Look below at the “Weekly Soil Sample 2020” with soil test values that shows how temperature, moisture, growing conditions and crop removal affect the pH and estimated CEC of the soil.
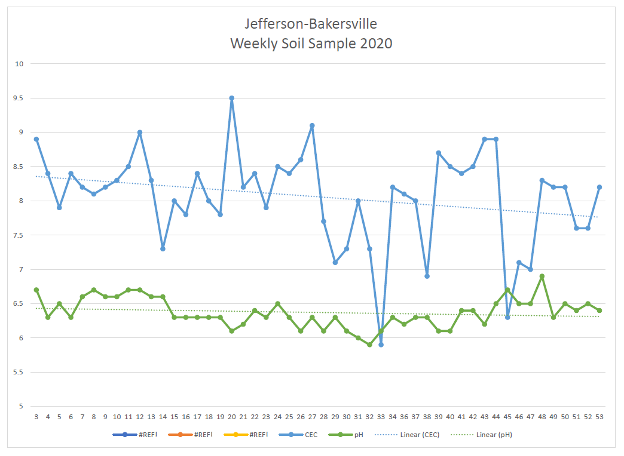
The blue line is the CEC from the soil test, the green line is pH. As the crop removes cations during the growing season, and when soil temperature and soil moisture conditions change through the growing season, it causes the pH, as well as the estimated (calculated) CEC, to change.
So how do you balance fertility, make a nitrogen recommendation, or get to some desired ratios based on a moving target? How do you get calculated/estimated CEC number that is always in flux?
Here is one example (and one of the simpler equations) of many slightly different formulas for estimating CEC from a soil test. It uses buffer pH (BpH).
CEC= (Ca/400)+(Mg/240)+(K/780)+(12*(7-BpH)
Others add water pH (pHw), and Na and/or include micro nutrients into the equation. Plainly, you can see by adding or removing variables, how this can cause significant difference in the estimated calculations of CEC.
Soil Classification of CEC
For soil classification purposes, a soil’s CEC is often measured at a standard pH value. Some examples of this are the ammonium acetate method of Schollenberger and Dreibelbis (1930) which is buffered at pH 7, and the barium chloride-triethanolamine method of Mehlich (1938) which is buffered at pH 8.2. CEC that is calculated by these methods will result in values very different from the CEC of the soil at the actual field soil test pH. For an accurate measure of the CEC of a soil under field conditions, the BaCl2- compulsive exchange procedure (Gillman, 1979, Gillman and Sumpter, 1986; Rhoades, 1982) is suggested. This method gives an estimate of the soil’s capacity to retain nonacid cations under field conditions. Again, this result can be very much different than CEC that you may see via your soil test results. These methods measure the “real” CEC of a soil and will change very little from one testing to another. They also can be quite time consuming and expensive.
But again, what does this CEC number mean for soil fertility?
In simple terms, a CEC of less than 5 would be considered a “low” CEC soil and a CEC of greater than 5 would be considered a “high” CEC soil. Some universities use this CEC classification to guide recommendations on potash or supplying potash. But, only in the sense of low holding vs high holding power. The CEC is not really used to compute an absolute value, desired value, or desired ratio of potash. These inclusions of CEC into university guidelines are part of the basis of sufficiency level of available nutrients (SLAN), or buildup, and maintenance. There is little or no research to show that using CEC to get to some ideal level with basic cation saturation ratio (BCSR) concepts yields any better or increases yield over SLAN.
And after this explanation with many examples, there is nothing magical about CEC.
CEC can be a guide or indication of nutrient holding capacity.
A CEC derived from soil classification can be helpful in developing SLAN for soil test levels on soil types in general.
There is ESPECIALLY NOTHING MAGICAL about calculated or estimated CEC from a soil test. It’s just a calculated guess.
About the Author: Kelly Robertson


 and then