Harvest data is very beneficial when showing us what happened in a field, or to a product, but it doesn’t always give us the “why” we may have gotten a certain result. This data can be very powerful to help us to make input decisions and can be enhanced with technologies that provide insights into performance of these inputs. The question is often asked,” What was my most limiting factor?” and we can use digital tools to investigate this question. These technologies could range from as applied data to aerial imagery, however the two I want to focus on in this post focus on two of our main factors in crop development, weather and nitrogen monitoring.
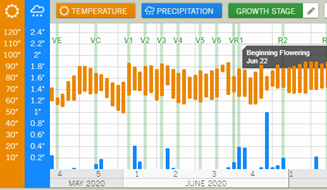
weather data and soybean growth stages
for a field.
In most cases weather has the largest impact on a crop’s success. It is often on our mind throughout the season and sets our expectations for harvest. How often do we go back and look at what the conditions were like at different stages of the crop’s life? How much rainfall did a field receive when it was filling pods? What were the conditions like during flowering? These are the types of questions that can be answered with a tool like the Advantage Acre Timeline. The timeline can display past weather data on a field for the whole growing season along with predictive data up to 11 months in advance. If a product and planting date is known for the field, it will also show growth stages with the weather information. This allows the user to easily see what conditions were like at a certain time of a crop’s life, providing insights into weather’s impact on the field’s performance. Looking at Figure 1 we can see this field had good temperature and moisture at the beginning of flowering but had an increase in nighttime temp and decrease in rainfall as the field moved to R2 through R5. This contributed to a shorter flowering period affecting yield.
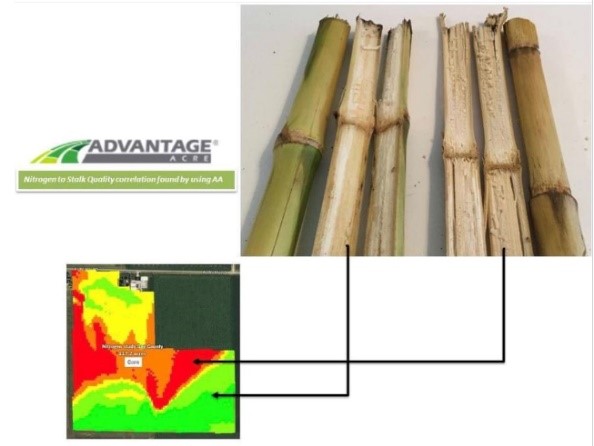
field that may be lacking N with confirmation
from stalks pulled from the areas.
Another valuable tool when analyzing results is to look at Nitrogen Modeling data. Were there areas of my field where I ran out of nitrogen that contributed to poor performance? Was standability an issue that was caused by dry weather and low nitrogen levels? Nitrogen modeling is a tool that can help us investigate these questions. In my company’s program you can look back at nitrogen levels during previous growth stages then use that insight, along with scouting, and observations at harvest to make a more informed decision. This information also can help you to be more efficient with nitrogen inputs in the future. The example in Figure 2 shows a field where the red areas have run out of nitrogen and the green areas are still sufficient. These were confirmed by pulling stalk samples and we anticipate this will affect yield when harvested.
These technologies are easy to use and valuable tools for any agronomic toolbox. There are many technologies today that allow us to understand our crops better than ever before. The important thing to do is try to move forward utilizing digital tools in decision making and find what works best in your situation.
About the Author: Jason Carey


 and then