Paulson, N., G. Schnitkey, C. Zulauf and J. Colussi. “The Rising Costs of Soybean Production in Illinois.” farmdoc daily (13):208, Department of Agricultural and Consumer Economics, University of Illinois at Urbana-Champaign, November 14, 2023. Permalink
Historically high returns and farm income levels for corn and soybean producers in Illinois from 2020 to 2022 have been accompanied by large increases in production costs (see farmdoc daily, August 29, 2023). The direct costs associated with corn production in central Illinois were the focus of a recent analysis (see farmdoc daily, September 26, 2023). In today’s article, we shift focus to the direct costs associated with soybean production.
Since 2000, the direct costs associated with soybean production in central Illinois have increased at an average annual rate of 5.4%. The costs associated with primary inputs (seed, fertilizers, and pesticides) have grown at average annual rates slightly above the total direct cost average, while other direct costs (storage, drying, and insurance) have increased at average annual rates slightly below the direct cost average.
Total direct costs are projected to reach record levels for 2023 and then decline for 2024. The direct cost decline for 2024 is led by projected declines in fertilizer and pesticide costs, while seed costs are expected to remain stable.
Total Direct Costs Projected to Decline Slightly in 2024
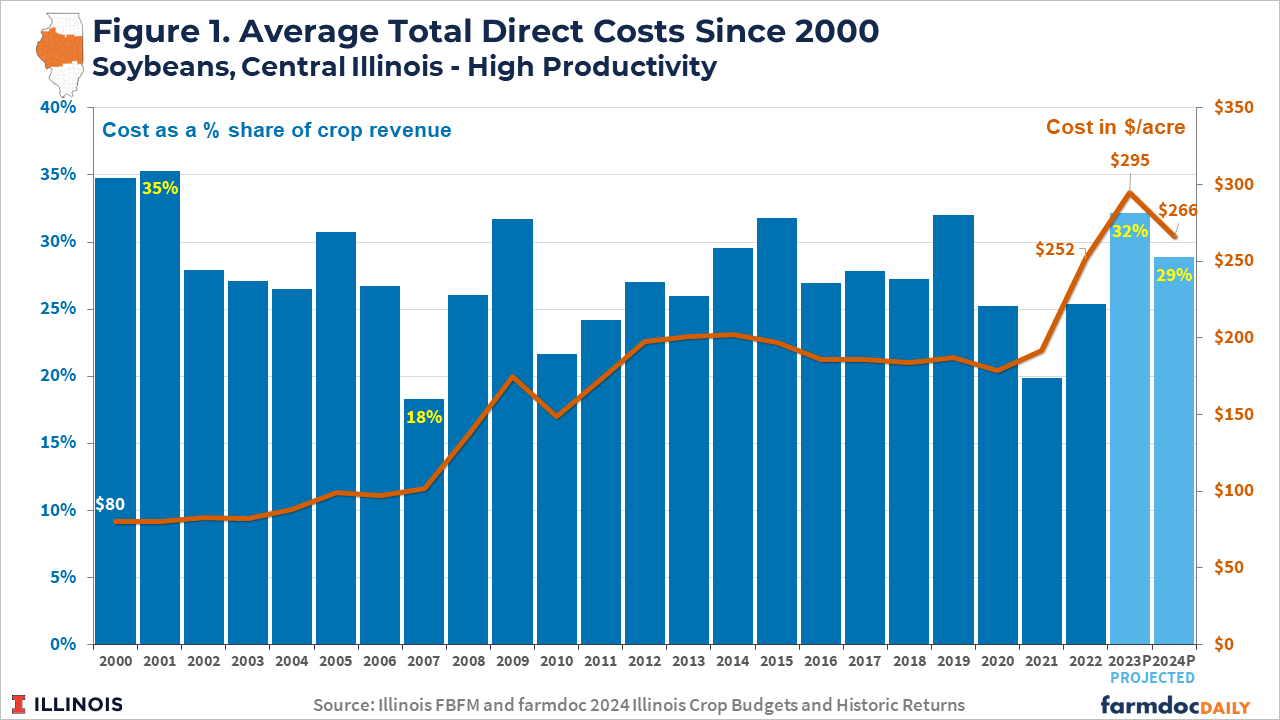
Direct costs include the cost of production inputs such as fertilizers, seeds, and pesticides (herbicides, insecticides, fungicides). Costs associated with drying, storage, and crop insurance are also included in the direct cost category. Total direct costs for soybean production in central Illinois have increased over time from $80 per acre in 2000 to $252 in 2022 (see Figure 1), which implies an average annualized growth rate of 5.4% between 2000 and 2022. Direct costs for the 2023 crop year are projected at a record level of $295 per acre, with a decline to $266 per acre currently expected for the 2024 crop year based on recently released crop budgets (see farmdoc daily, August 29, 2023 and 2024 Illinois Crop Budgets).
Credit – farmdoc, University of Illinois
From 2000 to 2022, direct costs averaged 27.4% as a share of crop revenues (yield x price received). Direct costs were just 18% of revenues in 2007, when excellent yields and prices resulted in an increase in revenues with only a moderate increase in costs relative to the previous year. Direct costs for soybeans were around 35% of crop revenues for the 2000 and 2001 crop years and have exceeded 30% of revenues four times since 2004 (2005, 2009, 2015, and 2019 crop years). The record costs for 2023 are projected to be 32% of revenue. Even with the decline in per acre direct costs budgeted for 2024, direct costs as a share of revenue are expected to be 29%, remaining above the historical average of 27.4% (see Figure 1).
Fertilizer Costs Expected to Remain Above Average
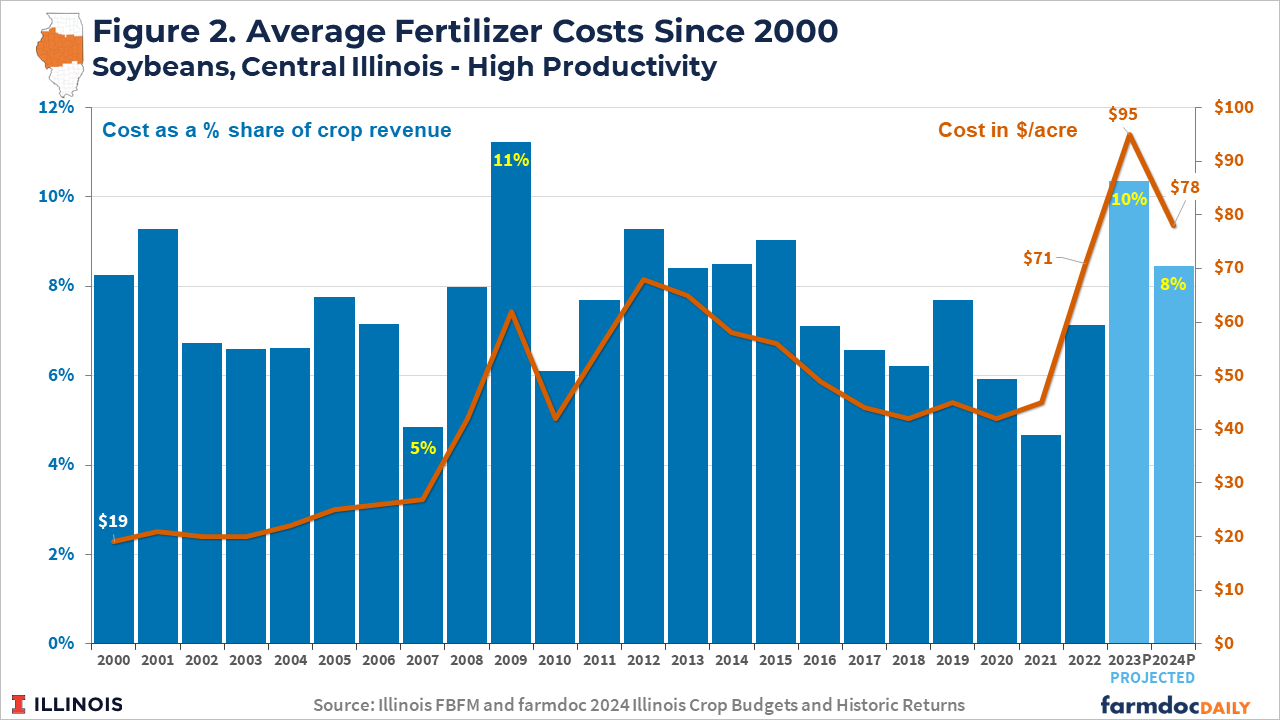
Fertilizer costs for soybeans in central Illinois increased from $19 per acre in 2000 to $71 per acre in 2022, an average annual growth rate of 6.2%. Fertilizer costs are projected to reach $95 per acre for the 2023 crop but decline to $78 per acre for 2024.
As with corn production, fertilizers used for soybean production tend to be one of the inputs with the most variability from year to year. While the longer-term trend is for soybean fertilizer costs to increase, an extended and consistent decline was experienced from 2012 until 2020. Sharp, multi-year increases were also experienced from 2007 to 2009, 2010 to 2012, and 2021 to 2023.
The USDA’s Chemical Use survey data suggest applications of nitrogen (N), Phosphate (P), and Potash (K) fertilizers have increased since 2012 in terms of the proportion of acres that receive applications. The average application rates for P and K fertilizers on soybean acres have also increased.
Credit – farmdoc, University of Illinois
On a revenue share basis, fertilizer costs averaged 7.4% from 2000 to 2022. High prices for fertilizer used in 2023 result in a projected 10.4% revenue share. The fertilizer cost share is expected to decline to 8.5% in 2024, remaining above the longer-term average of 7.4%. Fertilizer costs as a share of revenue peaked at 11% in 2009 and were at a low point of 5% in 2007.
Seed Costs Projected at Record Highs
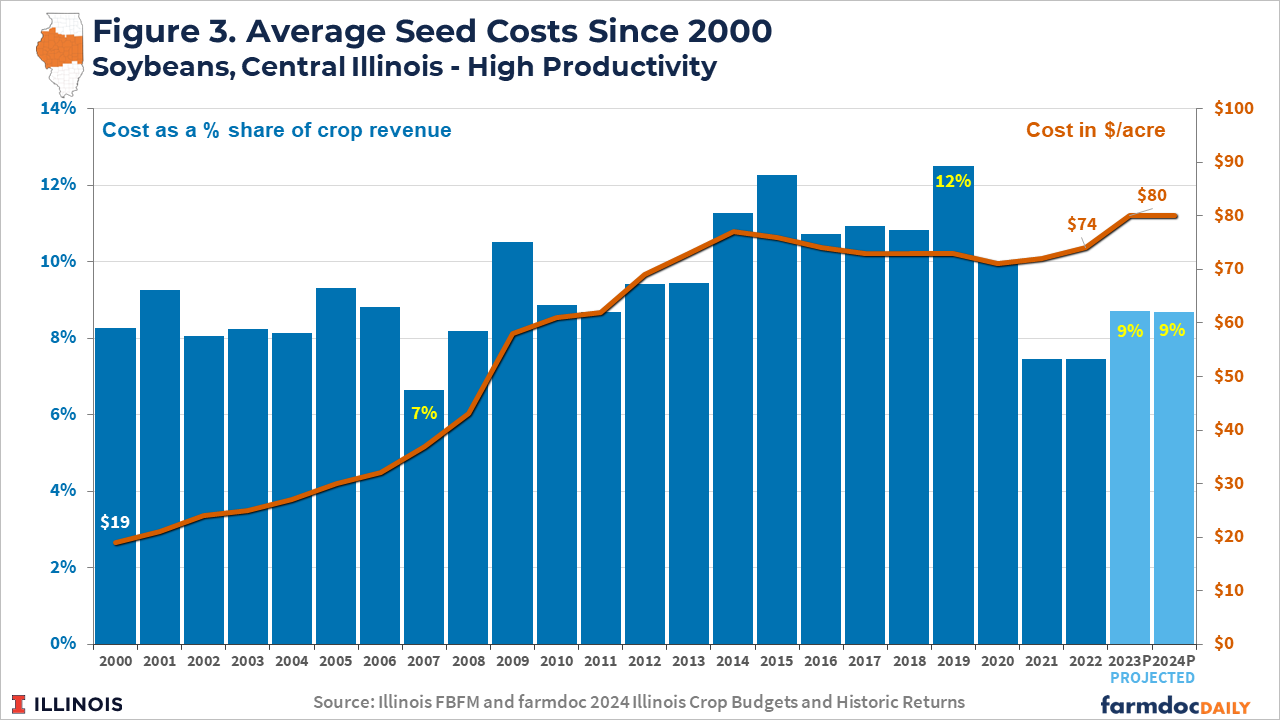
Soybean seed costs have increased from $19 per acre in 2000 to $74 per acre in 2022, averaging 6.4% in annualized growth. Most of the increase in seed costs occurred from 2000 to 2014, increasing from $19 per acre to $77 per acre. Adoption of genetically engineered seeds and expanded soybean acreage were contributing factors to increased seed costs during that time (Vaiknoras, 2023). Seed costs have been relatively flat since 2014, trending down slightly during the low return period from 2014 to 2020, and increasing again with the higher returns from 2020 to 2022.
Credit – farmdoc, University of Illinois
Seed costs are projected to reach a nominal record of $80 per acre for both the 2023 and 2024 crop years. On a revenue share basis, seed costs exceeded 12% of soybean revenues in 2015 and 2019 and experienced a low of 7% in 2007. Projections for 2023 and 2024 have the seed cost share at 9% of revenues, which is right at the average from 2000 to 2022.
Pesticide Costs Projected to Decline
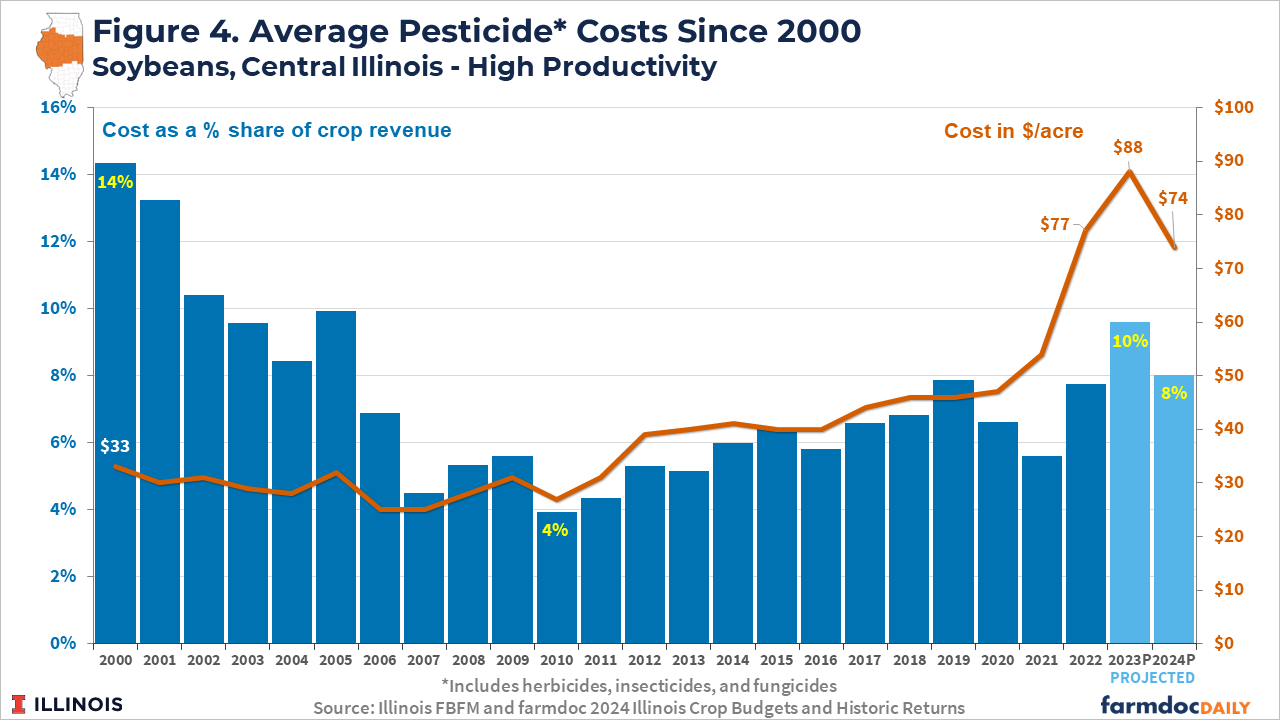
Pesticide costs have increased from $33 per acre in 2000 to $77 per acre in 2022, averaging 7.2% in annualized growth. However, the increase in pesticide costs since 2000 has also not been a consistent trend. Pesticide costs actually experienced a slight decline in dollars per acre from 2000 ($33/acre) to 2010 ($27/acre). As a revenue share, this represented a fairly dramatic decline from 14% in 2000 to just 4% in 2010.
In contrast, from 2010 to 2020, pesticide costs for soybean production trended upwards at a moderate pace both in terms of dollars per acre and as a share of revenue. Pesticide cost increases since 2020 have been more pronounced, with a near-doubling projected for 2023 ($88/acre) relative to 2020 ($47/acre). Cost as a share of revenue is expected to continue the upward trend since 2010, projected at 10% for 2023 and 8% for 2024.
Credit – farmdoc, University of Illinois
As discussed in our analysis of pesticide costs for corn production in Illinois, increased weed resistance and adoption of fungicide use on soybean acres likely explains a significant share of the upward trend in pesticide costs. The USDA’s Chemical Usage survey suggests the use of fungicides on soybean acres has doubled, from 11% of soybean acres in 2012 to 22% in 2022. Herbicide use has remained very high, at 98% of soybean acres, over the same time period but resistance has shifted the use of glyphosate products (89% of acres in 2012 to 78% of acres in 2020) to alternatives such as dicamba (applied to 18% of soybean acres in 2020). In general, increased chemical use on soybean acres has also been a factor in increasing soybean acres and soybean yields over the past 20 years (Vaiknoras, 2023).
Summary
The direct costs of soybean production in Illinois have increased at an average rate of 5.4% per year since 2000. Total direct costs are projected to decline slightly from record levels in 2023 for the 2024 crop year but remain at historically elevated levels as a share of expected soybean revenues. The decline in total direct costs is due mainly to projected decreases in fertilizer and pesticide costs on soybean acres from 2023 to 2024. Seed costs are projected at their highest dollar per acre levels since 2000 for both 2023 and 2024.
Changes in direct costs for soybeans, as with corn production, have generally followed changes in revenues and returns to crop production. However, costs typically adjust to higher and lower returns with a one to two-year lag. Lower corn and soybean prices projected for the 2023 and 2024 crop years may slow some of the larger cost increases associated with the high returns for the 2020 to 2022 crop years, but a return to the lower income and return levels experienced over the 2014 to 2019 period is expected.
Acknowledgment
The authors would like to acknowledge that data used in this study comes from farms across the State of Illinois enrolled in the Illinois Farm Business Farm Management (FBFM) Association. Without their cooperation, information as comprehensive and accurate as this would not be available for educational purposes. FBFM, which consists of 5,000 plus farmers and 65 professional field staff, is a not-for-profit organization open to all farm operators in Illinois. FBFM field staff provide on-farm counsel with computerized recordkeeping, farm financial management, business entity planning and income tax management. For more information, please contact the State Headquarters located at the University of Illinois Department of Agricultural and Consumer Economics at 217-333-8346 or visit the FBFM website at www.fbfm.org.
References
Agricultural Chemical Use Survey, United State Department of Agriculture. https://www.nass.usda.gov/Surveys/Guide_to_NASS_Surveys/Chemical_Use/
Paulson, N., G. Schnitkey, C. Zulauf, J. Colussi and J. Baltz. “The Rising Costs of Corn Production in Illinois.” farmdoc daily (13):175, Department of Agricultural and Consumer Economics, University of Illinois at Urbana-Champaign, September 26, 2023.
Schnitkey, G., N. Paulson, C. Zulauf and J. Baltz. “2024 Crop Budgets.” farmdoc daily (13):157, Department of Agricultural and Consumer Economics, University of Illinois at Urbana-Champaign, August 29, 2023.
Vaiknores, K. 2023. “U.S. Soybean Production Expands Since 2002 as Farmers Adopt New Practices, Technologies.” Amber Waves, United Stated Department of Agriculture, July 26, 2023.
About the Author: farmdoc


 and then