This is the third blog post in a series from NASS.
Happy New Year to everyone. I hope the holidays were good to you and your family. This is the third blog post in a series from NASS. I will use it to explain how NASS makes crop production forecasts and estimates. I will use soybeans as the example crop, but the processes are very similar for other crops.
NASS publishes a series of soybean yield and production forecasts from August through November each year. Each of those forecasts use farmer reported yields from the Agricultural Yield survey. For the August report, yield survey results are combined with NASS acreage estimates that were published in June. The result is a set of acreage, yield, and production statistics for all major states and crops. Later in the year, NASS will review the certified acreage totals from the Farm Service Agency and make acreage adjustments if they are needed.
In 2021, the Agricultural Yield Survey sample sizes for Illinois ranged from a high of 845 in August to a low of 295 in November. Response rates ranged from a high of 81.9 to a low of 74.6. Thank you VERY MUCH to all the farmers that helped us this year. We really appreciate your cooperation.
And I would also like to thank the NASDA (National Association of State Departments of Agriculture) enumerators that did our phone interviews and gathered data for our field counts and measurements survey.
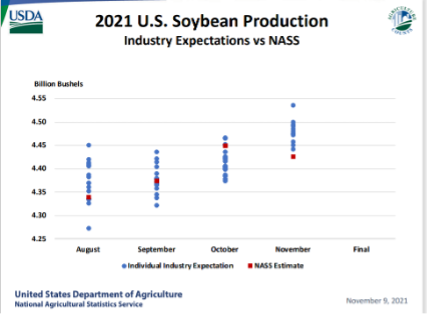
The image below shows how NASS soybean production forecasts compared to industry expectations for August through November. On January 12, NASS will publish a final set of acreage, yield, and production statistics for the 2021 season. These estimates are derived solely from a farmer reported yield survey conducted in December. That project has a MUCH larger sample than the Agricultural Yield survey. For Illinois, the sample size was more than 2,600.
In addition to farmer-reported yields, NASS also uses data from field counts and measurements. We call this project the Objective Yield survey. Data collection started in late August and continued through harvest for 200 soybean fields in Illinois and more than 1,500 fields in 10 other states. In September, our NASDA enumerators counted plants, blooms and pods in two small units in those fields. The field counts data were summarized and combined with farmer-reported yields (and satellite data) to produce the Crop Reports for September through November.
Enumerators return to the same fields monthly to update counts until the crop reaches maturity. At that point, enumerators harvest the soybean pods by hand in those two units and send them to our lab in St. Louis. The lab staff threshes the pods, weighs the beans, and records the moisture content for each sample. These data points are combined with yield reports from farmers to help produce yield forecasts.
NASS uses additional data sources for crop reports. They include remote sensing data from satellites as well as a yield model that includes all those sources combined. The graphic below shows the national sample sizes and data sources that were used for the November 2021 monthly crop production report.
NASS statisticians also play a major role in the monthly crop reports. Prior to the survey, they review the list of sampled farms and ensure that each gets special handling, if requested. They provide training materials to the NASDA enumerators that will contact the famers. As data are collected, NASS staff conduct data analysis by investigating any unusual data. They investigate those data points, possibly recontact farmers, and make updates if they are needed.
When data collection is complete, NASS staff will conduct more data analysis using the totals and averages from the current survey. They will compare current survey statistics to historical survey results. Based on those relationships, NASS statisticians will determine a yield recommendation, encrypt it, and send it to Washington, DC.
There is one more round of data analysis that is done under “LOCKUP CONDITIONS” in Washington, DC. LOCKUP CONDITIONS essentially means that no outside communication is possible. All cell phones are left outside the lockup, the landline phones inside the lockup area are disabled, internet connections are also disabled and even the window shades are locked in place (to prevent visual signaling). Here is a link that provides more information about the NASS LOCKUP PROCESS: USDA – National Agricultural Statistics Service – About NASS – Report Procedures
After the report is published, NASS staff wait one hour and then conduct a Question and Answer session on Twitter. It’s called #StatChat and you can find it on Twitter @usda_nass on the day that major reports are published. The next one will be on January 12, 2021 at 12:00 Central time and anyone can observe and participate.
After that, it’s time to begin preparing for the next project and start the cycle again. This blog post is just an overview, but much more information is available. For more details, including descriptions of the models used in the Objective Yield survey, go to this link: https://www.nass.usda.gov/Education_and_Outreach/Understanding_Statistics/Yield_Forecasting_Program.pdf
Thank you again to the IL Soybean Association for this chance to tell the story of NASS. I hope all of you have a safe and prosperous year in 2022.
Mark Schleusener
Illinois State Statistician, USDA-NASS
About the Author: Mark Schleusener


 and then