This article was originally published on FarmdocDaily.
The costs of machinery ownership and labor are two important factors when considering tillage decisions (Swanson et al., 2020). In an October farmdoc daily article (October 26, 2020), we examine tillage benchmarks for corn on Illinois farms in the Precision Conservation Management (PCM) dataset. Similarly, in this article, we explore tillage benchmarks for soybeans on Illinois farms in the PCM dataset and provide information about the types of tillage occurring and the average cost and returns for each tillage type.
Precision Conservation Management (PCM)
We summarize data from Precision Conservation Management (PCM) for soybean production on farmland in central Illinois from 2015 to 2019. PCM is a farmer service program led by the Illinois Corn Growers Association and Illinois Soybean Association in partnership with over 30 entities including conservation groups, private foundations, supply chain providers, the Soil and Water Conservation Districts, and the Natural Resource Conservation Service (NRCS). In an effort to address the goals of the Illinois Nutrient Loss Reduction Strategy, the mission of PCM is to help farmers make decisions about adopting on-farm conservation practices in a financially responsible way. Through PCM’s regional specialists, PCM works one-on-one with over 300 farmers enrolled in its 16-county service area, representing over 200,000 acres of Illinois farmland.
Tillage on Illinois Farms
The type of tillage used in Illinois has changed over time, with greater use of conservation tillage, particularly after the passage of the 1985 Food Security Act which required farmers to use an approved conservation plan on Highly Erodible Land (HEL). Most of these conservation plans use mulch-till or no-till on HEL. The introduction of glyphosate-tolerant soybeans in 1996 reduced farmers reliance on tillage for weed control which also encouraged increase of no-till soybean acres (Simmons and Nafziger 2009).
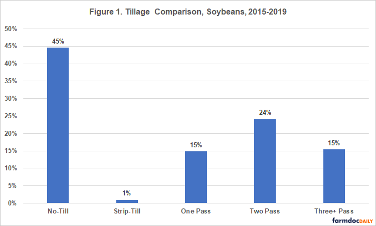
Figure 1 shows the percent of soybean fields summarized by the number of tillage passes in the PCM data from 2015 to 2019. A fall and spring tillage pass followed by planting would be a two-pass system. Most soybean fields in the dataset (45%) are no-till. Two or more tillage passes are used on 39% of soybean fields.
The percentage of fields in each tillage class changes over time as new farmers are added to the dataset and existing farmers within the dataset change their tillage practices. Figure 2 shows how the number of fields in each tillage class changes from year-to-year. The tillage classes are defined as follows:
1. No-till – no-tillage before planting soybeans.
2. One-pass-light – one tillage pass with light-intensity/low-disturbance tillage implement
3. Two-pass-light – two tillage passes with light-intensity/low-disturbance tillage
4. Two-pass-medium – two tillage passes that included one deeper tillage pass.
5. Three-plus –three or more tillage passes, any disturbance level.
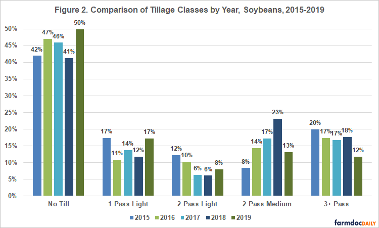
In 2019, there is a 9% increase in no-till and 5% increase in 1-pass light tillage as some fields shift from two-pass-medium and three-plus pass tillage to no-till and one-pass light tillage. The wet fall of 2018 and spring of 2019 likely prevented farmers from getting in the field for tillage, causing them to shift to no-till or one-pass tillage systems.
To read the full article, visit farmdocdaily.illinois.edu.
Sellars, S., L. Gentry and G. Schnitkey. “Tillage Benchmarks for Soybeans in Illinois.” farmdoc daily (11):39, Department of Agricultural and Consumer Economics, University of Illinois at Urbana-Champaign, March 16, 2021.
About the Author: Laura Gentry


 and then