2020 marked the third consecutive year with statewide total annual precipitation above the long-term average, and it was the eighth wetter than average calendar year since 2011. However, the statewide totals do not paint a complete picture of current moisture conditions around the state. While the wet trend continued throughout the year in southern Illinois and parts of northern Illinois, drought developed and has persisted in central Illinois. Here I will summarize current moisture conditions and both temperature and precipitation outlooks through spring.
Current Conditions
Virtually every part of Illinois was wetter than average through the first half of 2020, and this pattern continued through summer and fall in southern Illinois. However, a large swath of the northern half of the state was much drier than average in August and September of last year. This pattern has mostly continued through the end of the year and the first month of 2021. The map below shows 6-month precipitation departures from the 1951-2020 average across the central Midwest. Most areas along the Interstate 72 corridor are 6 to 9 inches drier than average over the last 6-months, while areas farther north and south have deficits from 2 to 5 inches.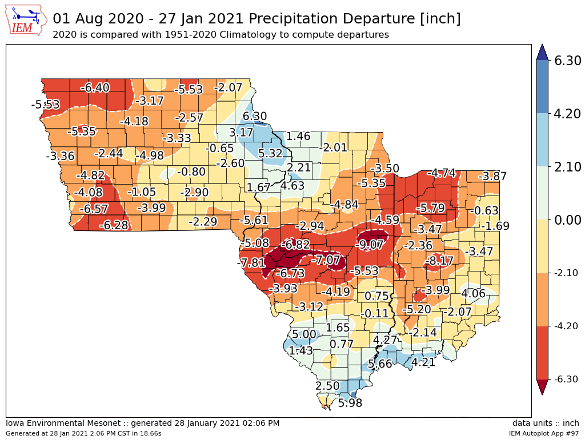 Figure 1. Precipitation departure from average over the last 6 months.
The exceptionally wet soils we carried over from 2019 and the first half of 2020 helped mitigate significant, widespread damage to yields from the very dry end of the growing season last year. However, the maps below show soil moisture conditions both currently (top map) and relative to where we were this time last year (bottom map). The soil moisture information from these maps comes from the NASA LIS Sport model system and not from direct observations. The model has been shown to do a good job capturing general patterns, although the absolute numbers may be somewhat different.
The top map shows current soil moisture conditions in terms of percentiles. The area in dark red across central Illinois indicates 0 to 40-inch soil moisture is at or below the climatological 2nd percentile, meaning extremely dry conditions for this time of the year. Although most areas of northern Illinois have below average soil moisture, the deficits are not nearly as large as those in central Illinois. Soil moisture in most parts of southern Illinois remains near normal for this time of the year. The bottom map shows the difference between soil moisture now versus this time last year, in terms of percent of soil porosity. All areas of the state are drier now than they were this time last year. In southern Illinois, this is an overall positive as it reduces (but does not eliminate) the risk of excessively wet conditions later in Spring. In contrast, the model shows significant loss of water in the top 40 inches of soil since the end of January 2020.
About the Author: Trent Ford


 and then